
パイプラインには まだ気づいていない 収益が眠っています
ほとんどの卸売プラットフォームのレポート機能は基本的なものに留まります。私たちは業界で最も堅牢なBIを構築しました。すべてのデータポイントが、意思決定へとつながります。
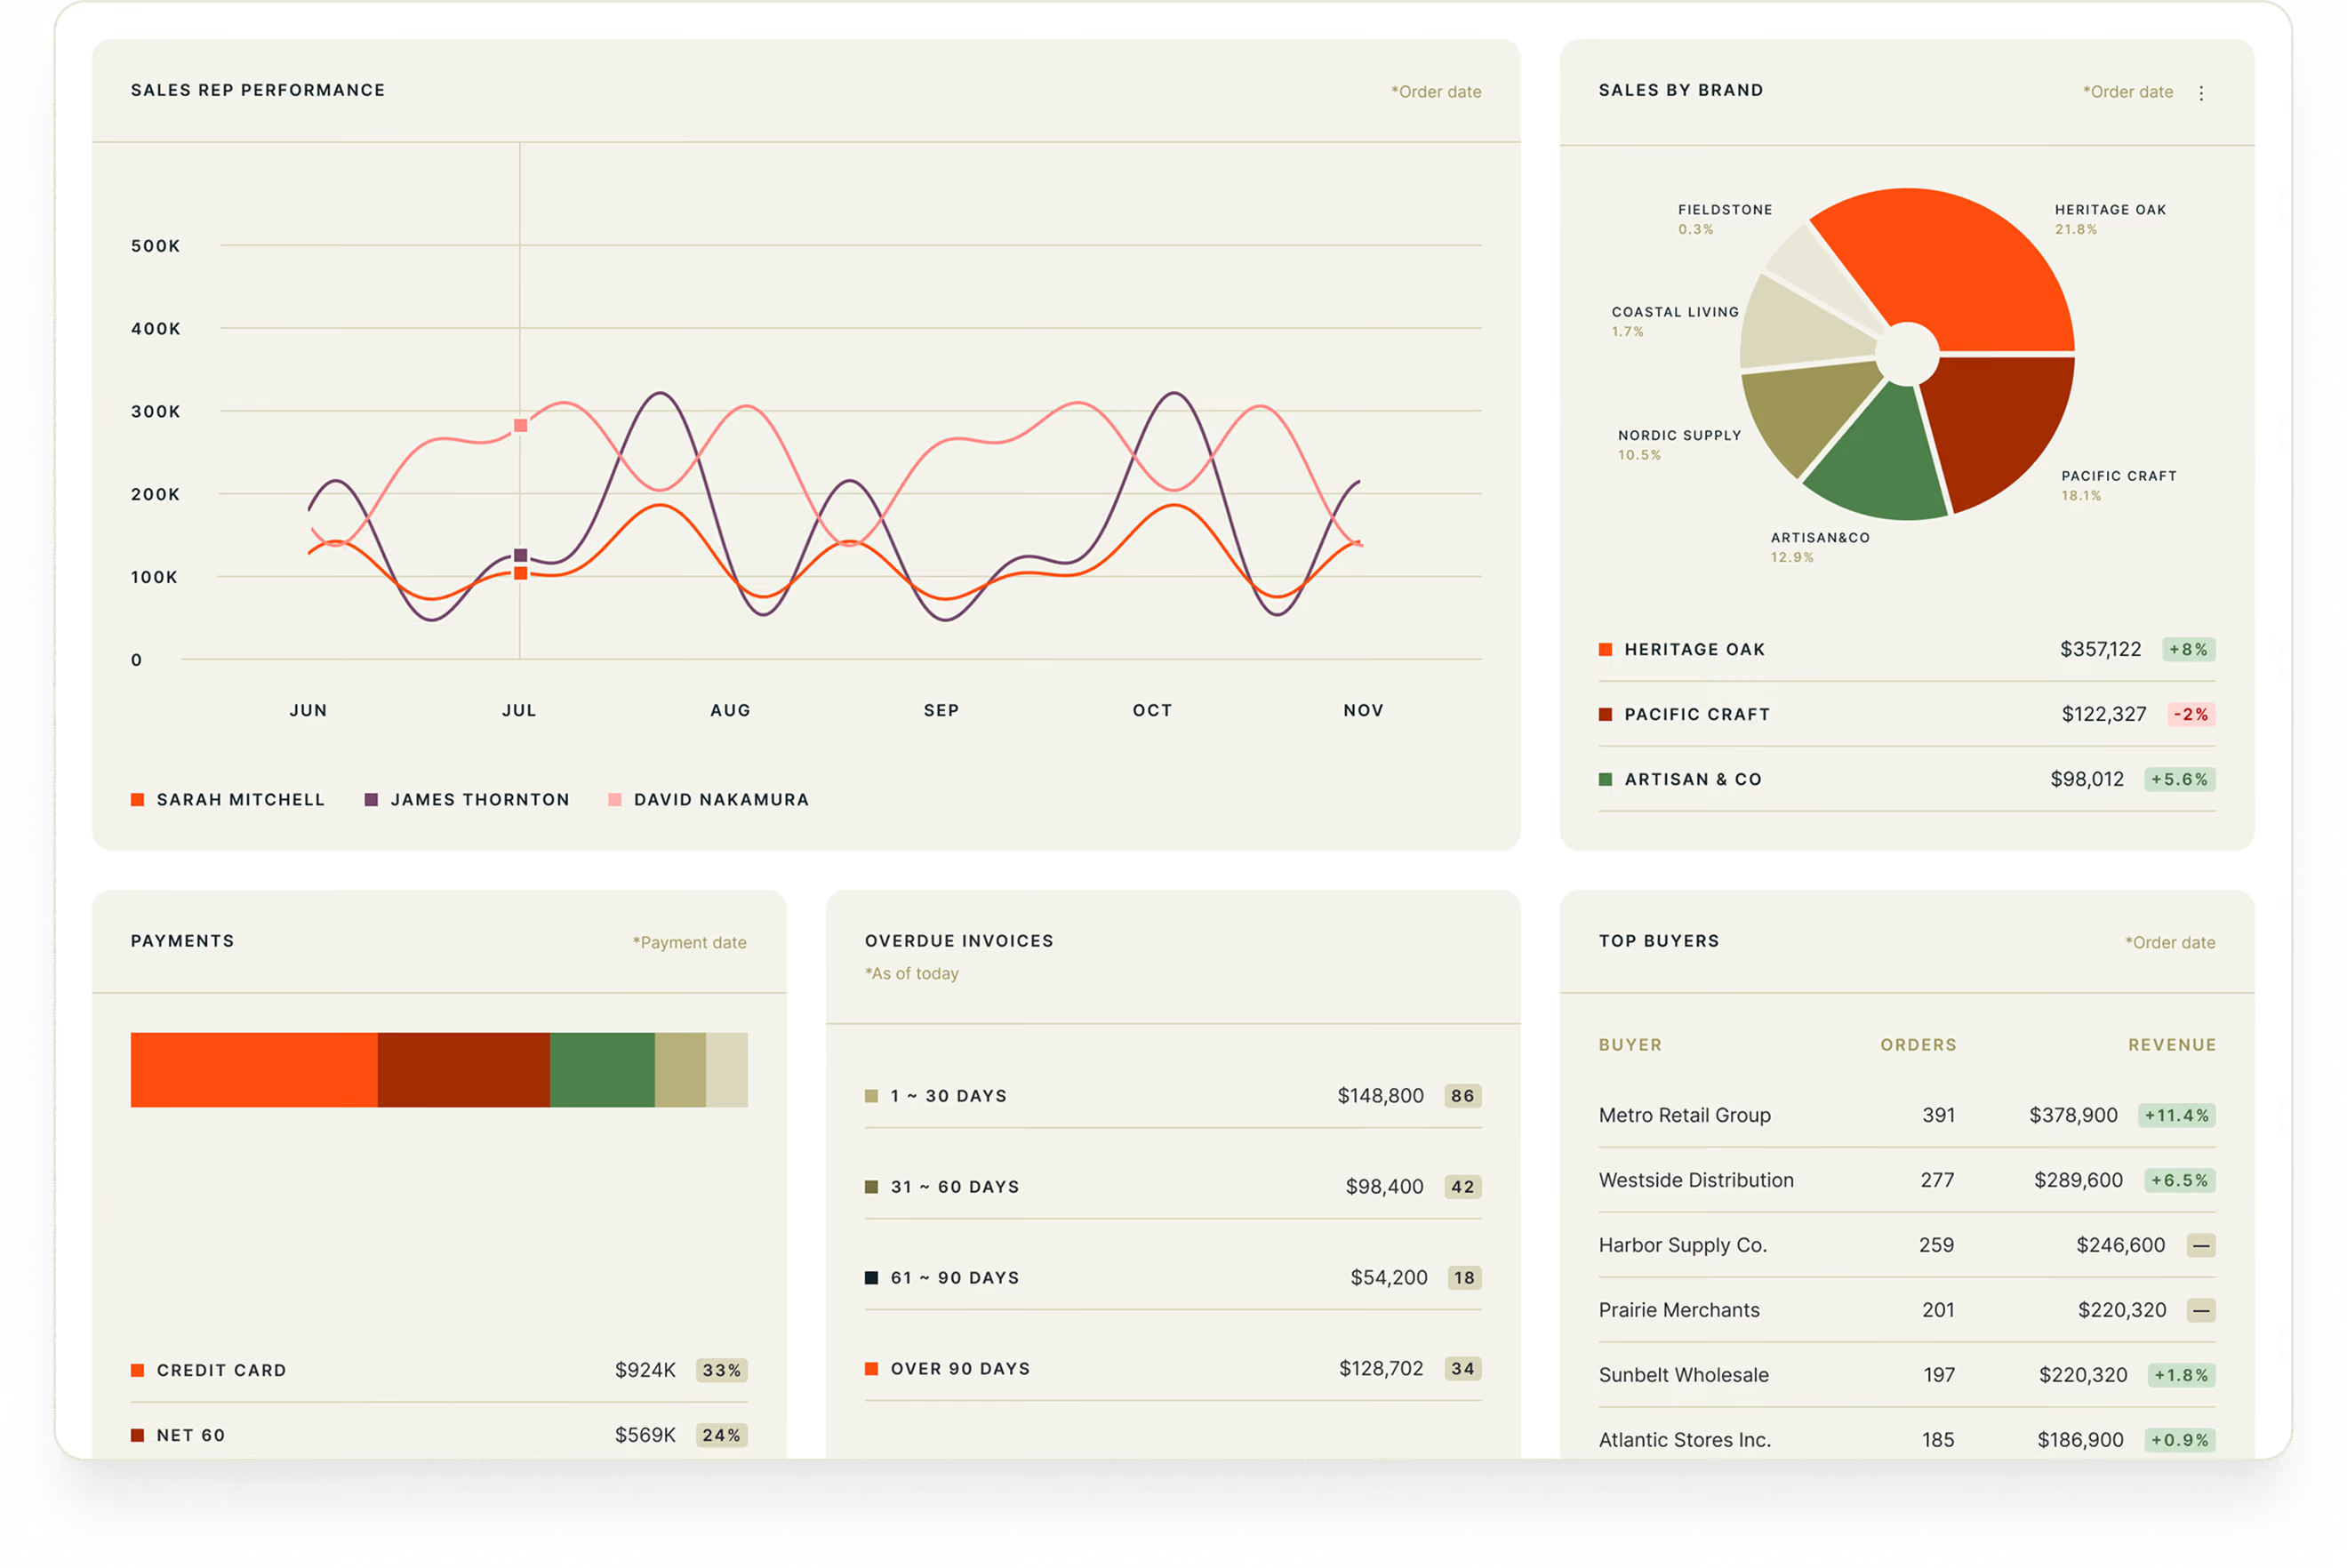


一目瞭然のビュー

その他の卸売プラットフォーム

Brandboomの流儀
開く。理解する。そして行動する。
面倒な作業は不要
多くのBIツールはEコマース向けに作られたものを卸売用に転用しています。
業界で17年の実績を持つ私たちは、B2Bに特化したインテリジェンスを構築しました。卸売の意思決定をよりスマートにするために必要な洞察を、的確に提供します。
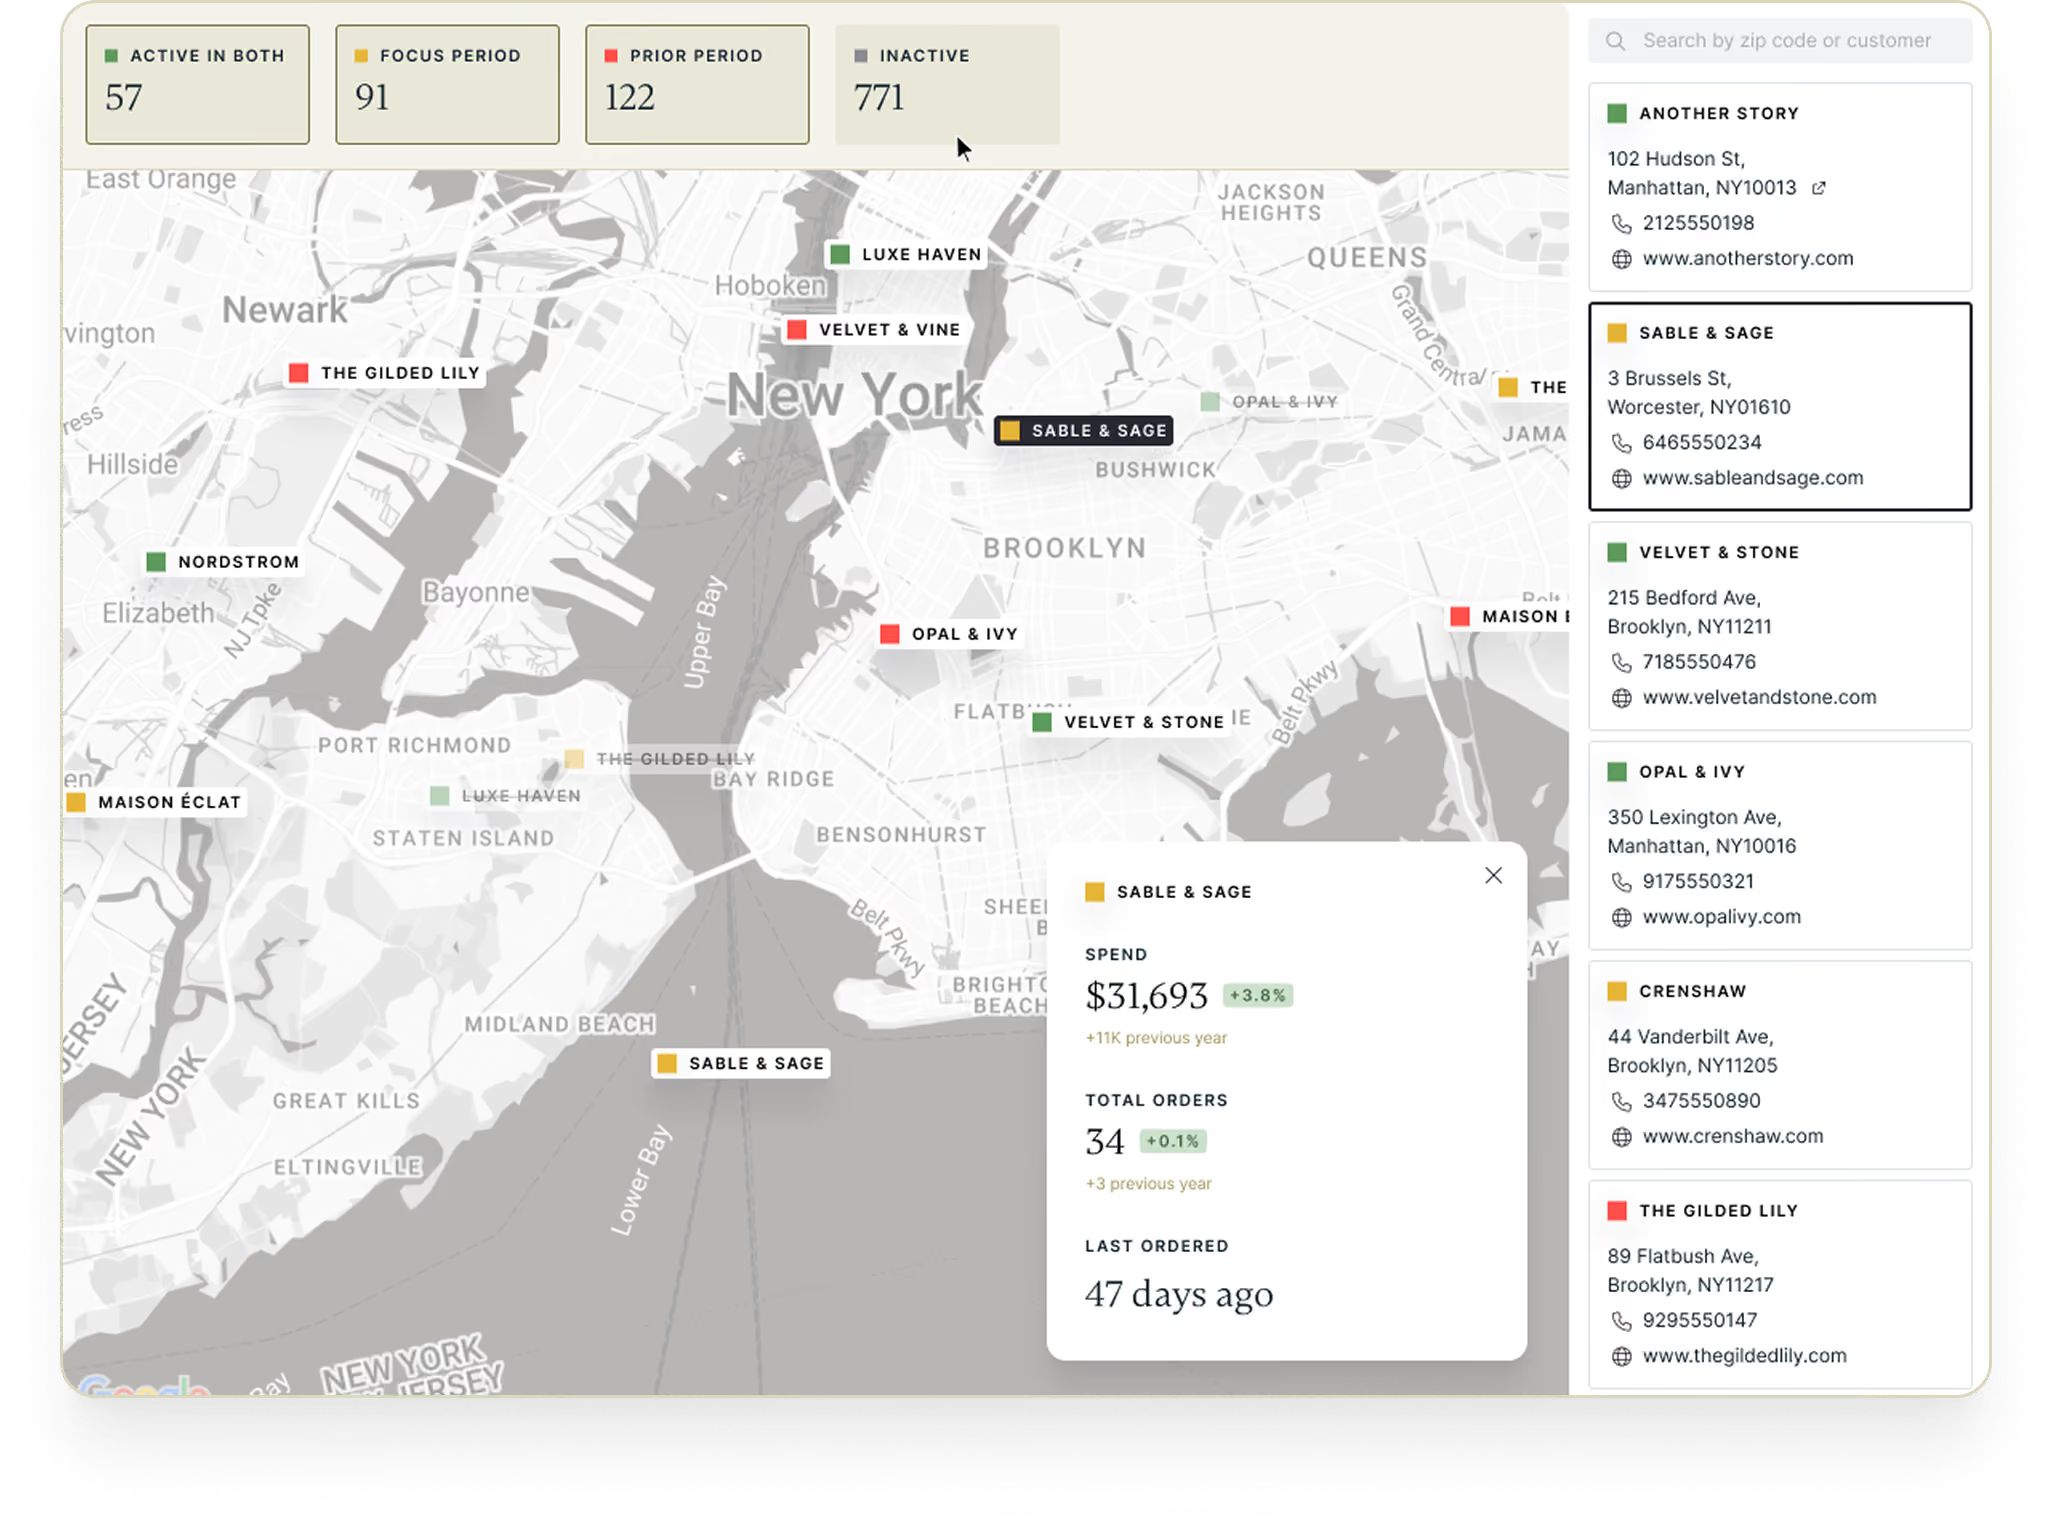
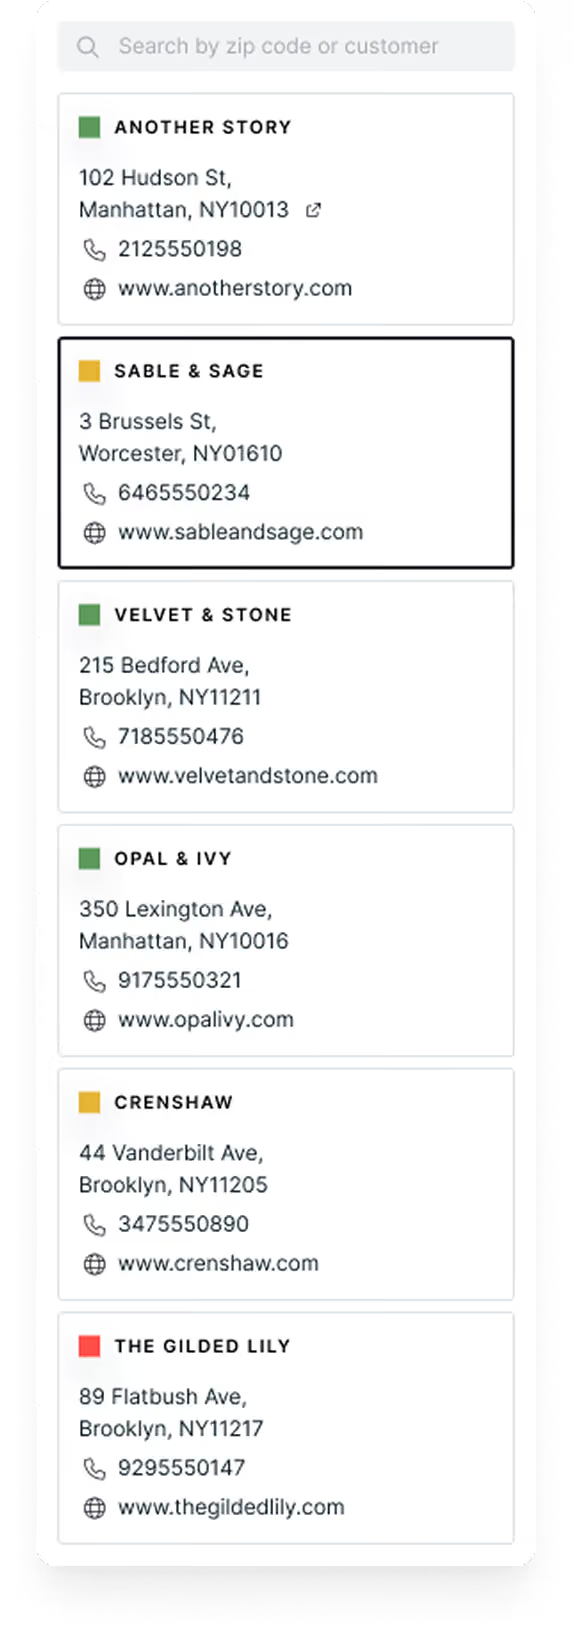
バイヤーを地図上で可視化

- バイヤーの所在地を概要で把握。注文済み、再注文済み、取引停止といったステータスごとに色分け表示されます。
- 営業担当者は訪問前にマップを開くだけで、取引が途絶えたアカウントや注文量の多いアカウントに基づき、次にどこへ行くべきかを即座に判断できます。
フォローアップが必要なバイヤーは誰ですか?
営業担当者は次にどこへ向かうべきですか?
取引が途絶えた高額アカウントはどれですか?
請求書の支払い状況を時系列で追跡
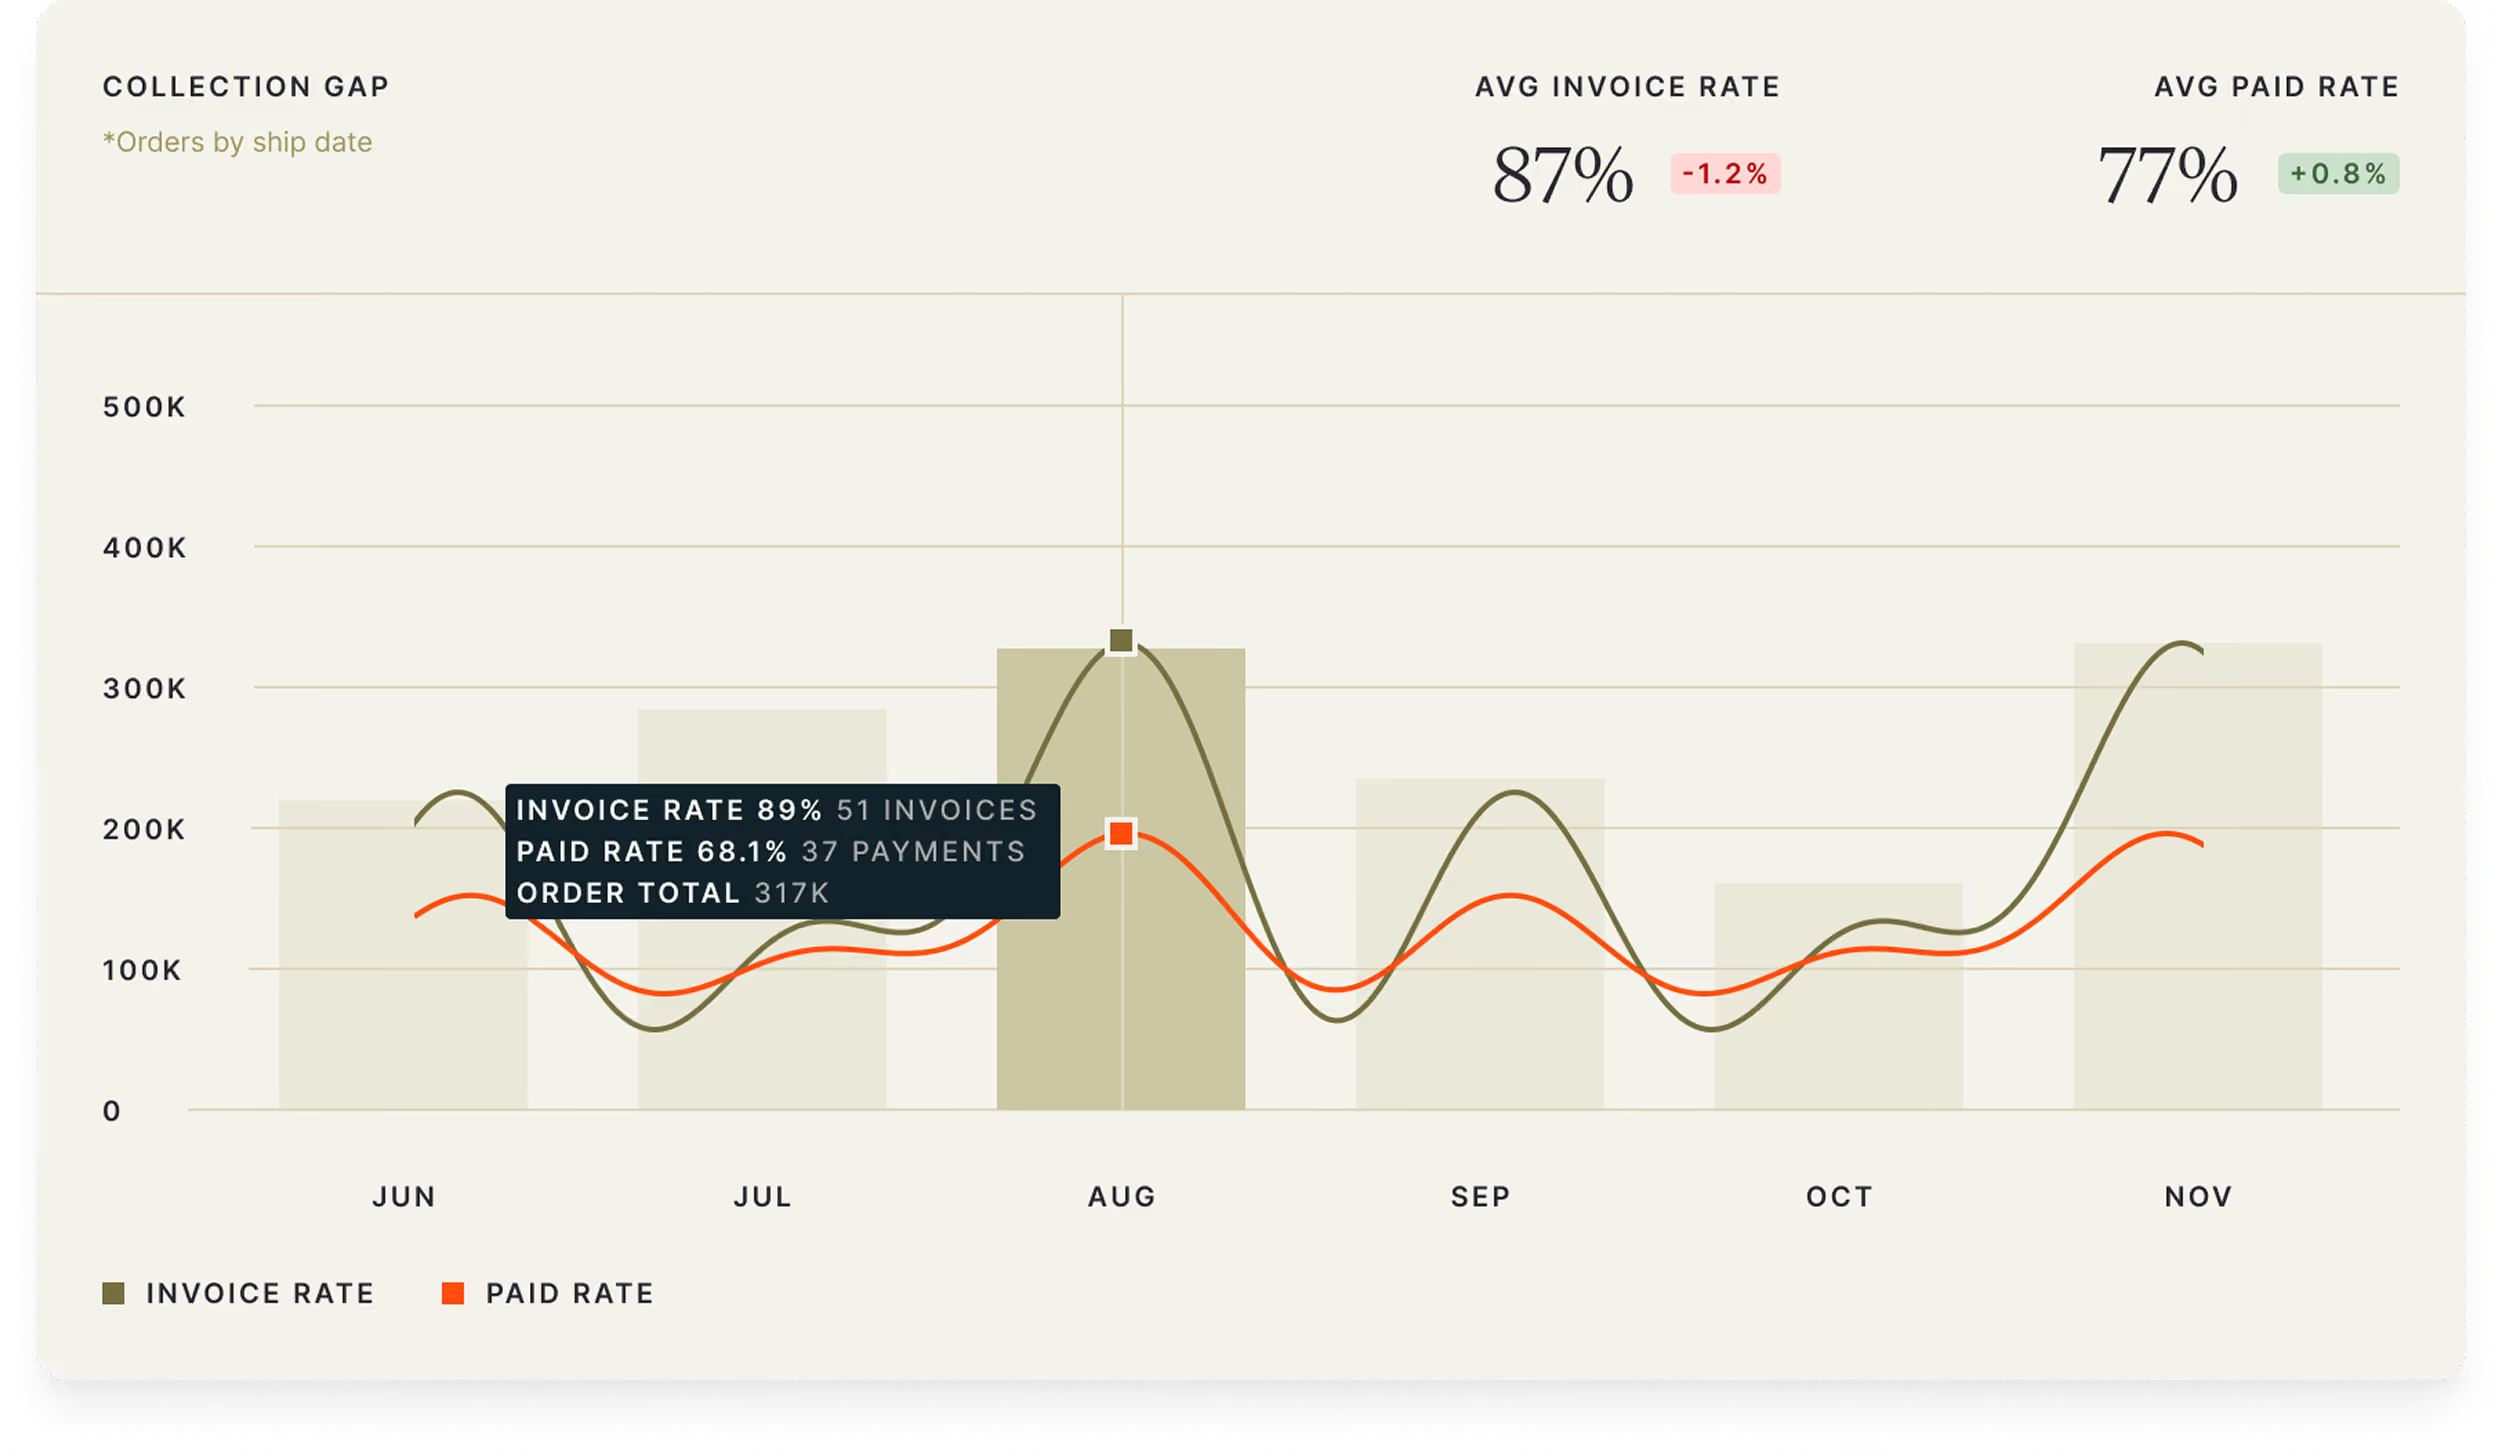
- 注文額と回収済み収益の差分を可視化し、経時的な追跡と解消を可能にします。
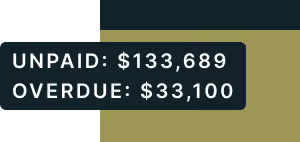
- 未払い請求書の状況を常に把握し、回収すべき金額を正確に管理しましょう。
未回収の収益はいくらですか?
どの請求書を督促すべきですか?
収益はどこで滞っていますか?
サイクル全体の健全性を確認する
- 注文収益 → 請求収益 → 回収済み支払いという、ライフサイクル全体を俯瞰で把握しましょう。
- 各段階の期間別パフォーマンスを追跡し、単なる注文数にとどまらない、パイプライン全体の可視化を実現します。
注文から現金化まで、実際にどれだけの収益が確保できていますか?
パイプラインのどこで損失が発生していますか?
注文は順調に収益へと転換されていますか?
初日からインサイトを得る
- 過去の請求書データをインポートして、すぐに状況を把握しましょう。次のシーズンを待つ必要はありません。
- Brandboom以外のデータも含め、過去の請求書データを取り込むことで、初日からより賢明な意思決定が可能になります。
昨シーズンの実績はどうでしたか?
過去の請求書から、次のシーズンに向けて注力すべき点は何が見えてきますか?
すべてのグラフが意思決定を導きます
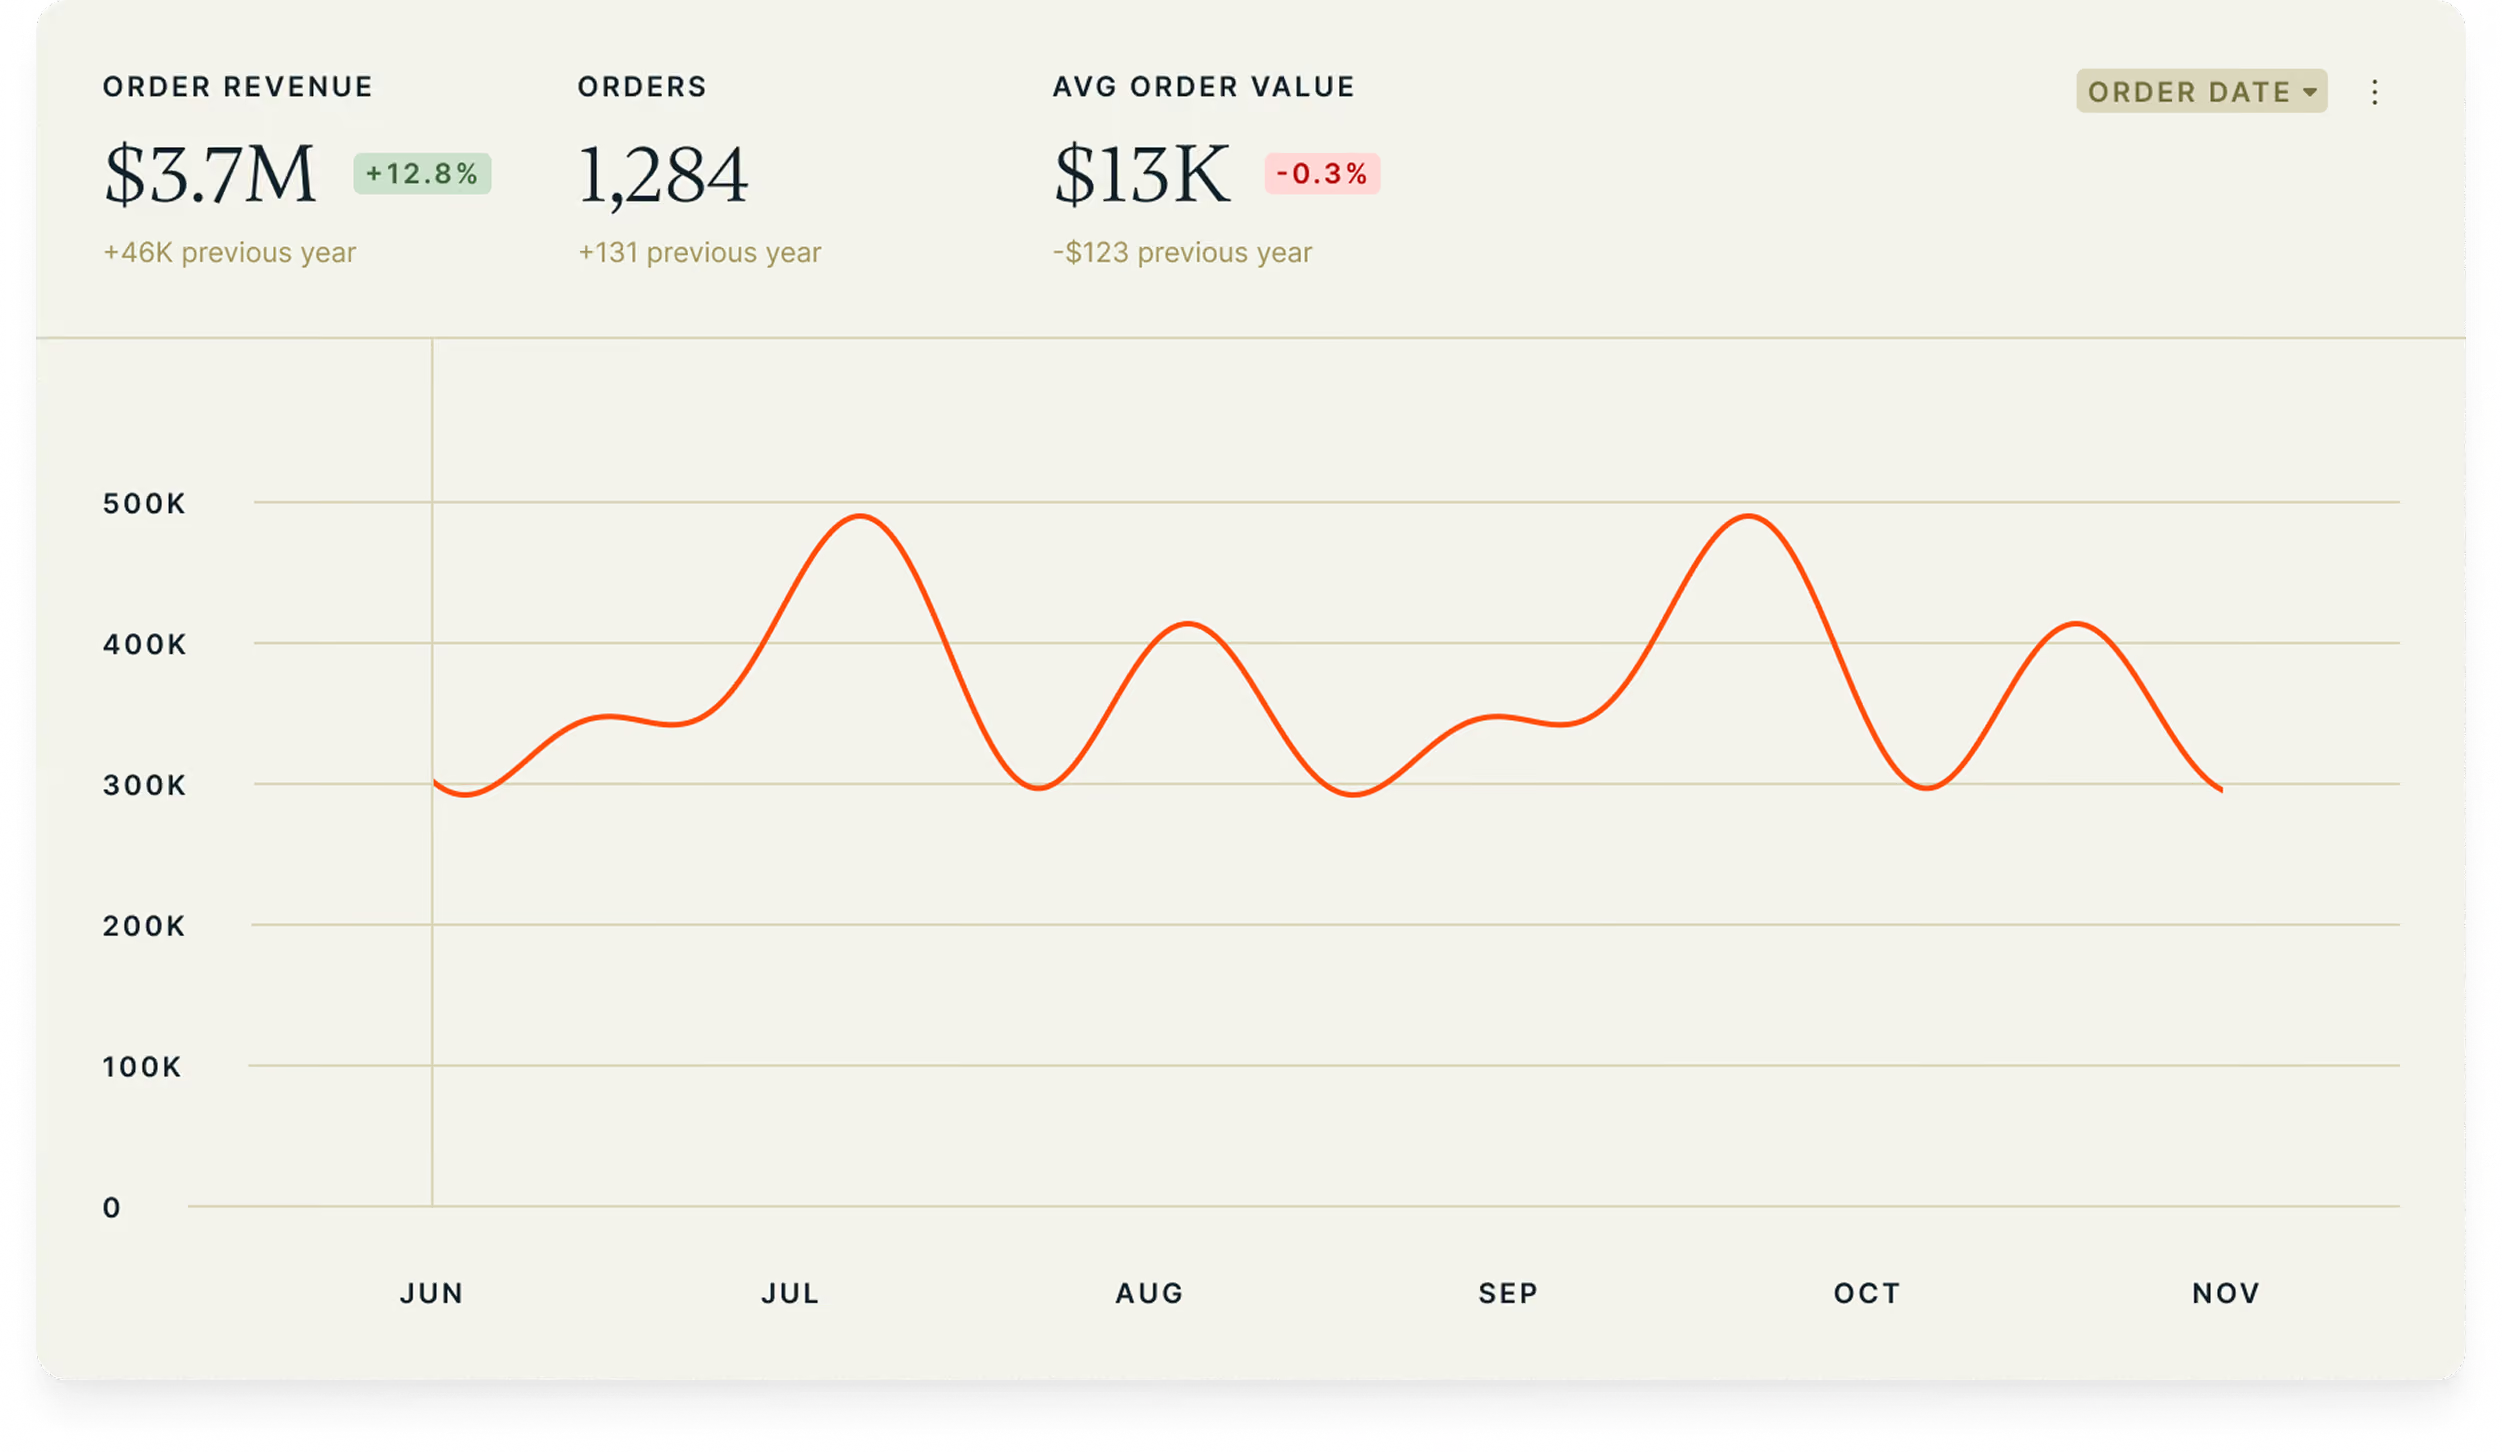
収益トレンド
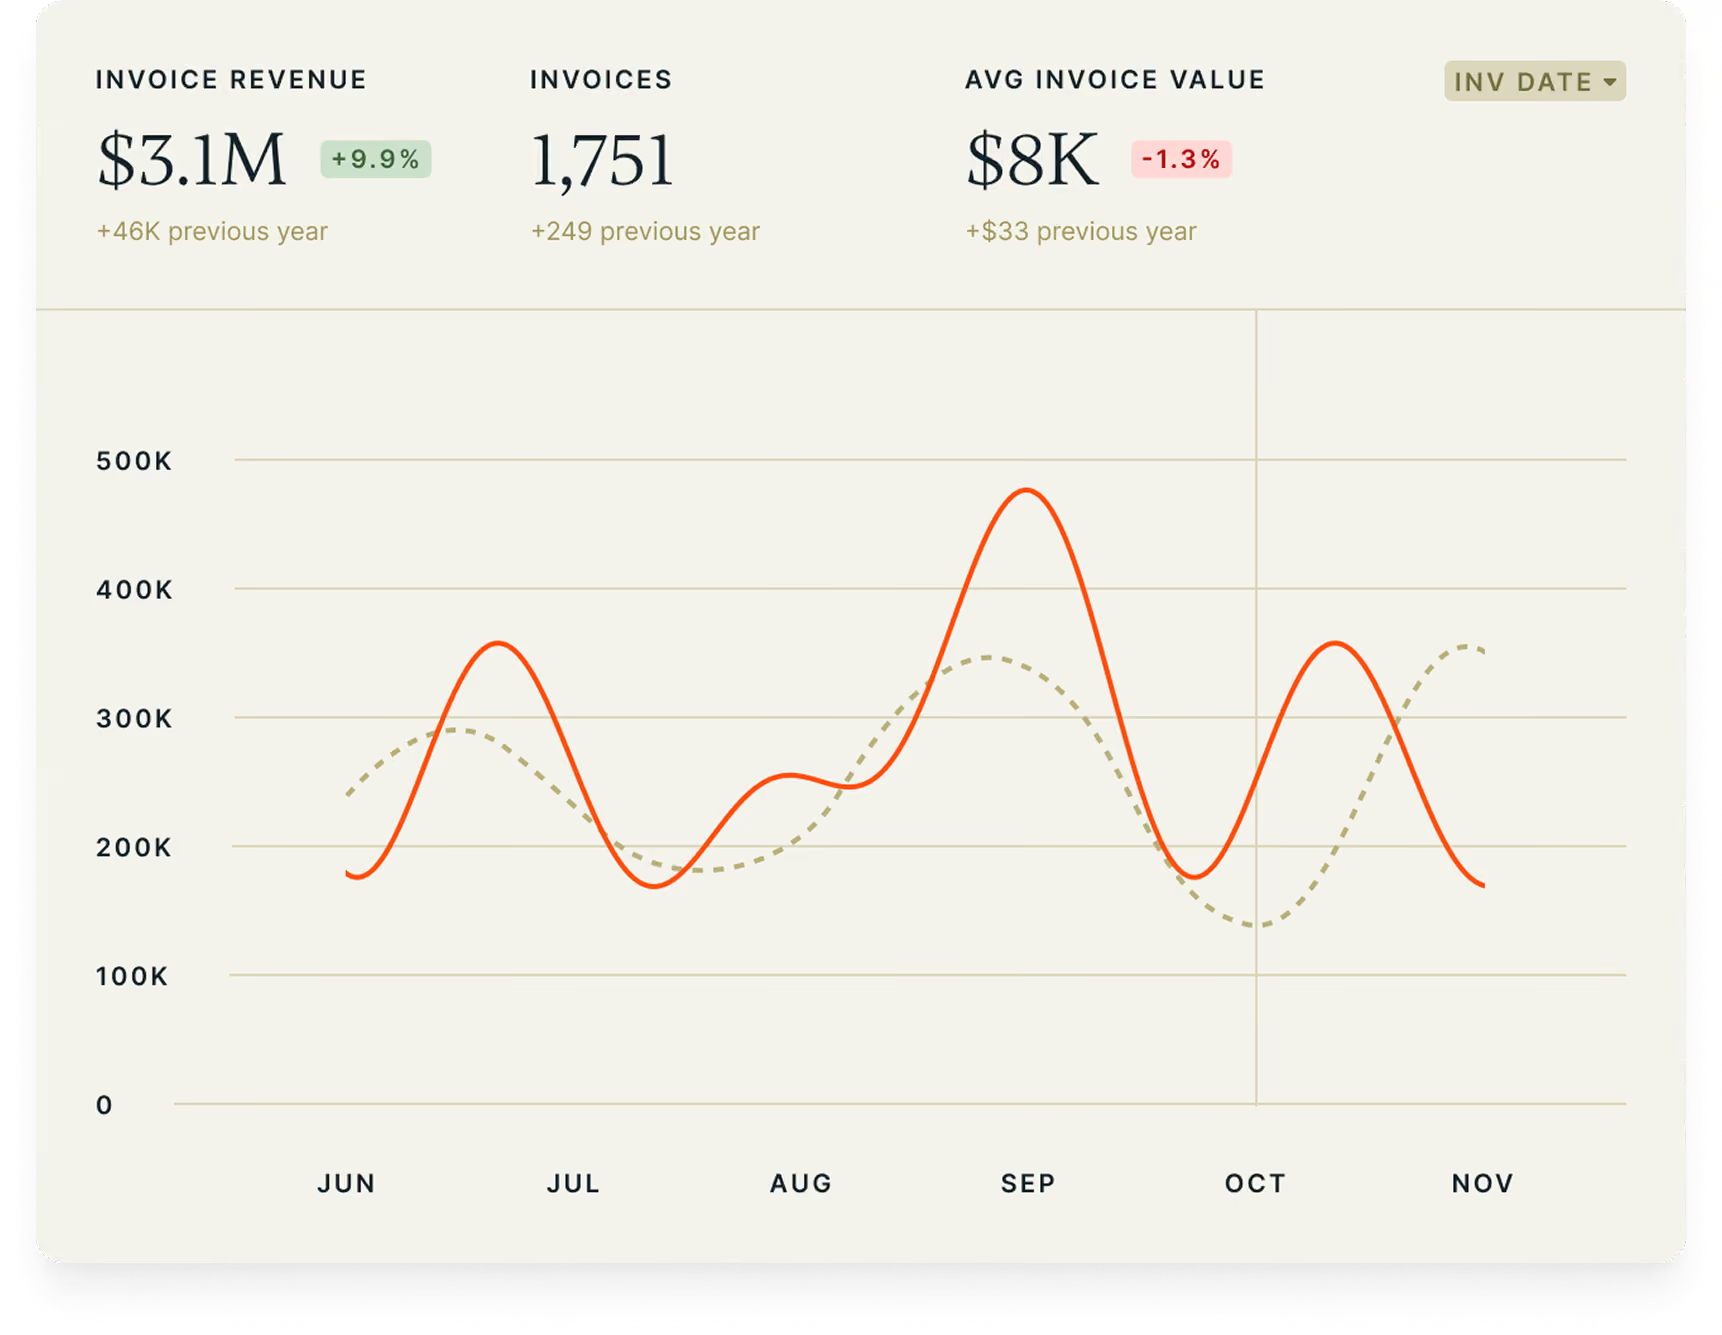
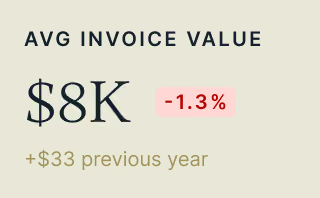
請求書
支払い

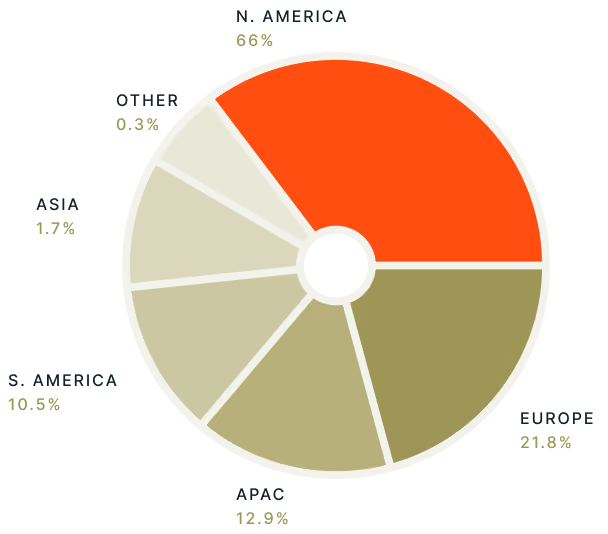
地域別売上
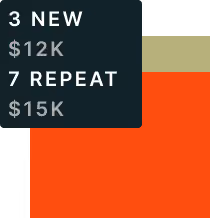
新規購入者とリピーター
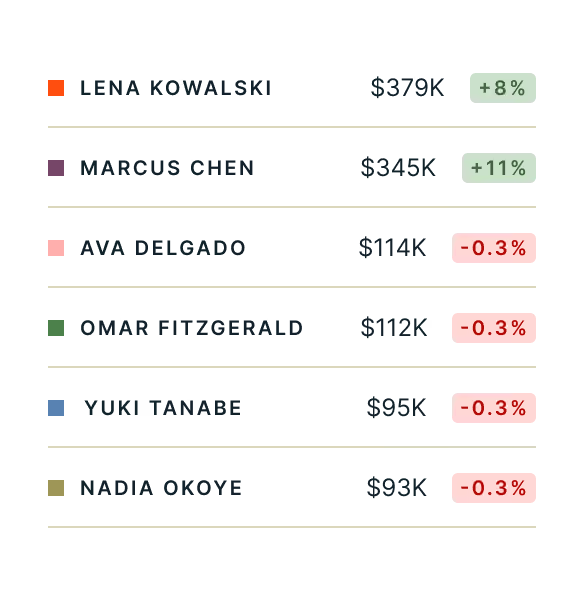
担当者のパフォーマンス
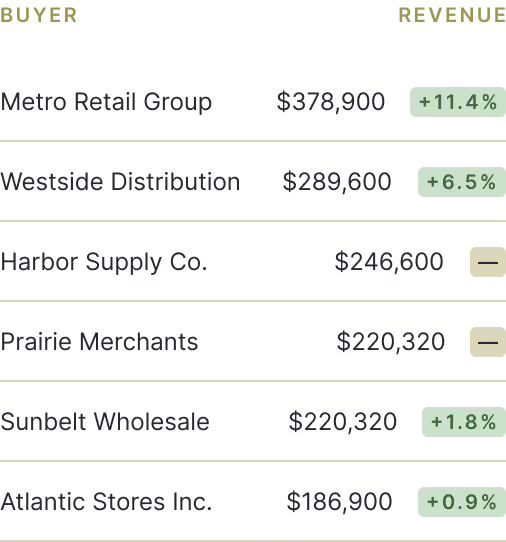
主要な購入者と製品
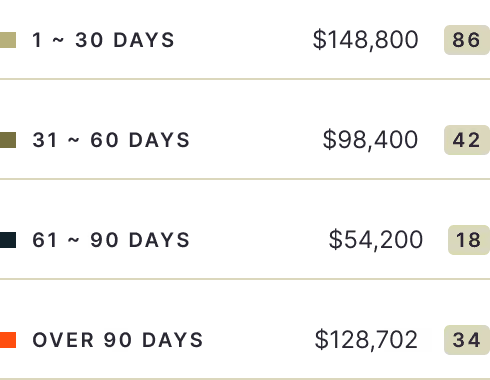
期限超過の請求書
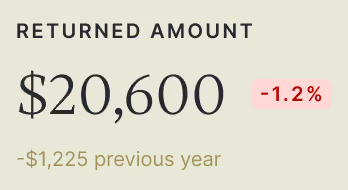
返品
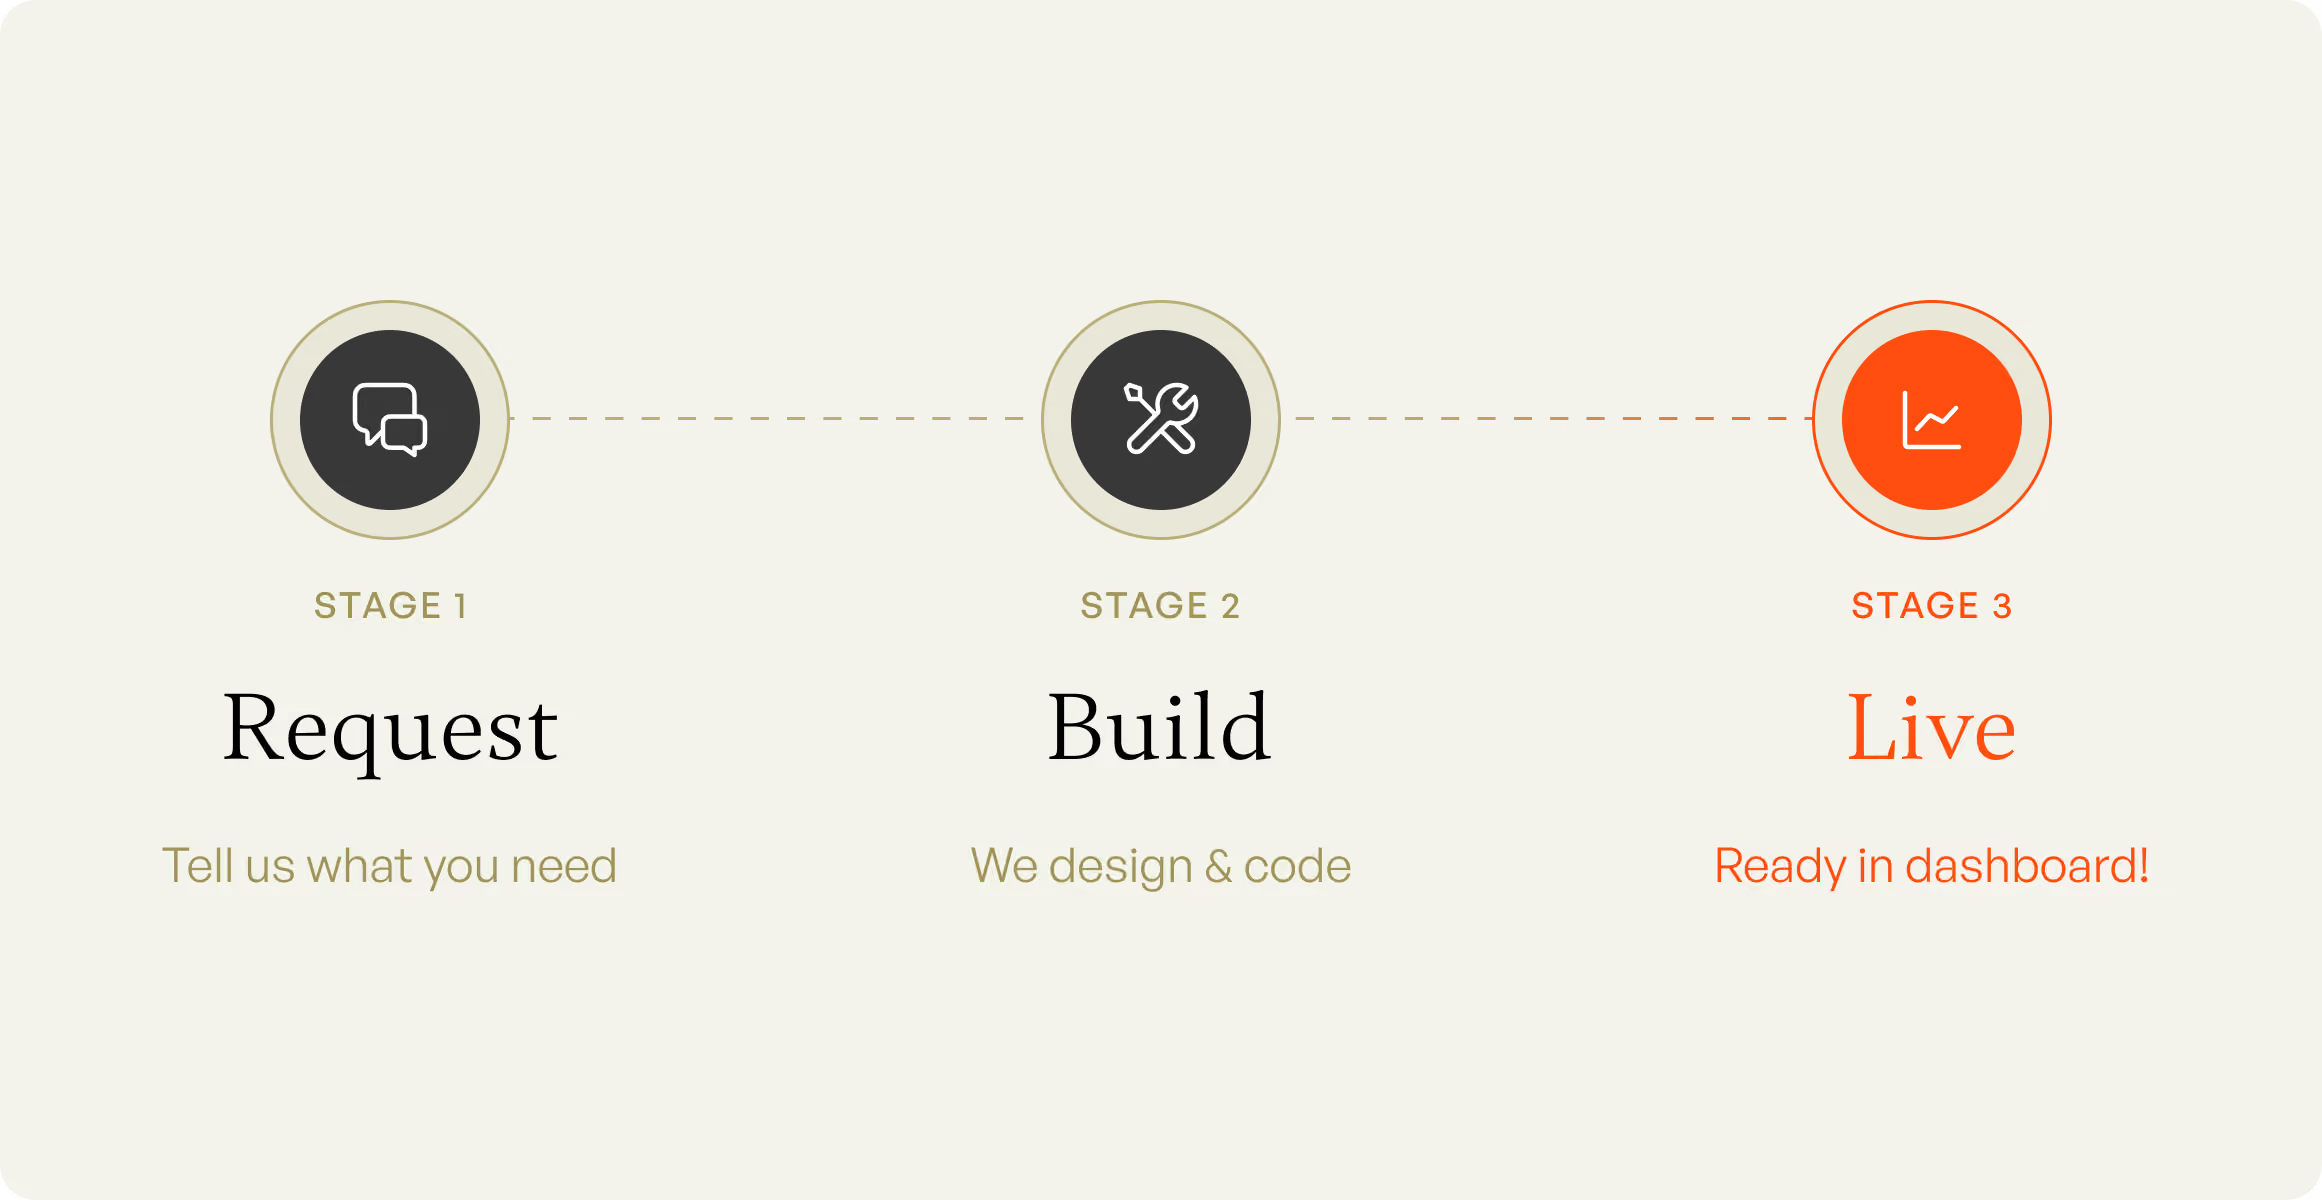
ご要望をお聞かせください。私たちが構築します
必要なデータビューがチャート選択に見当たりませんか?カスタムチャートを作成し、ダッシュボードに追加します。わずか数日で対応可能です。
チームが毎日使いたくなるダッシュボード
チャート選択
必要なチャートだけを表示するようにビューをカスタマイズ。すっきりとしたダッシュボードで、情報過多を防ぎます。

監査機能
異常値をクリックして詳細を診断。全体像を把握するためのトレンド分析から、原因を特定するための詳細なドリルダウンまで対応します。

フィルタリングと比較
日付範囲、ブランド、営業担当者、時間単位でチャートを細分化。前年比や前期間との比較も可能です。

リアルタイムデータ
最新の取引データを即座に反映。手動での日次エクスポートはもう不要です。

データエクスポート
プリセットされたCSV/Excelレポートを使用して、プラットフォームからチャートやインサイトを簡単に書き出せます。

よくある質問
What does a wholesale BI dashboard track?
Many BI dashboards only track revenue. A well-built BI dashboard tracks the full sales cycle — orders, invoices, payments, sales rep performance, and buyer engagement.
How is wholesale analytics different from e-commerce analytics?
E-commerce dashboards track revenue and stop there. Wholesale orders move through stages — order placed, invoice created, payment collected — each with its own date and status. Wholesale analytics need to track the entire pipeline, not just the sale.
What is the collection gap, and why does it matter?
The collection gap is the difference between what you’ve ordered and what you’ve collected — for example, $100K in orders might only translate into $80K in paid revenue. Tracking the gap over time shows you exactly what to chase.
How do I track whether my invoices are being paid?
The dashboard tracks what percentage of orders get invoiced and what percentage of invoices get paid. It also shows which invoices are overdue, how long they’ve been outstanding, and where to follow up next.
Can I see how my sales reps are performing by territory?
Yes. Rep performance is broken down by rep or territory, so you can see who's closing and where to focus.
How do I identify which buyers haven't reordered?
The buyer map shows a geographic view of your customer base and highlights lapsed buyers vs. active ones, by period — so you know exactly who to follow up with.
Can Brandboom build custom charts for my business?
Yes. Tell us which data you want to see, and we build it in days, not months.
Can I import historical invoice data?
Yes — you can import historical invoice data and see it in your BI dashboard right away, without waiting for a new selling season.
How current is the data in the dashboard?
The dashboard is updated instantly, so you're always looking at current data.